As we re-launch System Soft and build on our success in a variety of markets, I wanted to share our perspective on one in particular: Data engineering and analytics. This is the first in a series of articles to explore how to structure and manage data pipelines as data types and sources continuously morph and needs change. In this article, I look more closely at the nature of data and new ways for managing and monetizing it.
Although some may not see a strong connection between data engineering and the business side of things, there are, in fact, direct linkages.
One of the important roles of the data engineer is to architect data pipelines based on the business needs. As these needs vary, does the architecture.
Let’s look at a data pipeline from two perspectives: water and oil. In the case of a water, it is gathered and piped into one large main line. Engineers gather and monitor a variety of parameters: volume, velocity, pressure, temperature, etc., and manage curation based on demand.
Data pipelines have similar parameters and considerations that affect pipeline architecture:
- Batch
- Real-time, Near Real time
- Volume of the data
- Velocity of the data
- Processing needs
- Enrichment needs
- Systems from which it’s collected
- Consumers of the data
- Current technology echo system of the customer

Data continuously enters on one side of the pipeline, progresses through a series of steps and exits in the form of reports, models and views. The data pipeline is the “operations” side of data analytics.
Data is the new OIL
As data sources, uses, and value have grown, it has taken on the characteristics of oil rather than water. It has to go through many processing stages that are determined by its end use before it finds its true value. The first step is for companies to pipe this Big Data from different sources into a storage system to then perform
- Data analytics to visualize the data in dashboards or
- Machine learning algorithms to find patterns in the data and generate predictive analytics
There are 3 key considerations when looking at data pipelines:
- Architect the pipeline so all the downstream consumers can leverage the same pipeline to receive the data for their needs.
- Persist the lineage of all the data, so the origination and the path can be backtracked as needed
- Avoid data duplication to optimize performance and cost while still meeting business needs and SLAs
Building the Data pipeline
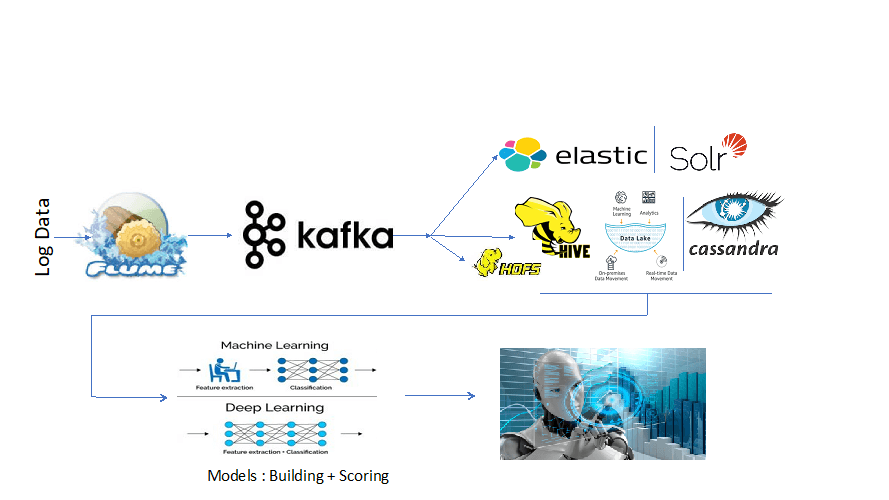
A Big Data pipeline is architected using lot of tools. For example, as the Data that gets ingested through pipeline, parsers parse this data for distributed file system, NoSQL, or Cloud storage. Let’s look at a reference architecture we implemented at few clients.
Our senior Big Data engineer, Anton Prabhu, has built many Big Data pipelines for many clients, using a variety of tools and technologies to setup the Big Data pipeline to their Big Data lakes.

Syslog NG: This tool collects the delta data from different data sources. It bundles all of the data from different sources as a single package and transports those packages to other channels such as Flume or Kafka.
- Input : Has the source information
- Filter: Filter the logs or necessary information using regex patterns
- Output: The destination where we want to send the data
Flume: Another data pipeline channel that streams the data from one source and syncs it to destination. The destination can be Distributed file system or NoSQL database.
Kafka: Messaging system, which stores the data as partitions of a topic. It works based on the publisher and subscriber model.
Spark: Widely used tool to parse and transform Big Data and can also be used to store the data in a Hadoop distributed file system.
Elastic Search, Logstash & Kibana: NoSQL database, where we store the data into Elastic search as indices. This data can be easily indexed quickly and can also be visualized on Kibana as dashboards.
HDFS: Used for long-term archival for batch analytics.
Real Use of Big Data Storage
When it comes to Big Data storage, options available are a distributed file system (Hadoop Distributed File System – HDFS), NoSQL, or a graph databases (Elastic search, Cassandra, MongoDB, Neo4J, etc.) as unstructured or semi-structured data.
This data collection is mainly used by data scientists to do machine learning or predictive analytics and can also be used to visualize as Dashboards.
Long-term archival of data can also be used to do machine learning, deep learning, and AI for model building and scoring.
He has has also seen some companies store the data into graph database to solve discrete mathematics problems. One such example is storing operational data into a graph database, then visualizing the network of nodes or machines and their edges as links between nodes. This helps figure out the easiest way of detecting the failure nodes from active nodes or machines.
Stay Tuned
I hope you found this useful. The next blogs will focus on examining different pipeline technology combinations and connection to different use cases.
I’ll also include an analysis of how this fits into implementation across different cloud stacks.
